

Time for some more fun with ChatGPT with code interpreter! For this experiment, I obtained a dataset containing about a year’s worth of Pizza sales. The idea was to quickly analyze the ±48,620 rows of data to understand key sales themes and generate ideas to increase profitability. As expected, Code Interpreter made this a breeze.
The Challenge
I started with the challenge as originally framed in the dataset:
For the Maven Pizza Challenge, you’ll be playing the role of a BI Consultant hired by Plato’s Pizza, a Greek-inspired pizza place in New Jersey. You’ve been hired to help the restaurant use data to improve operations, and just received the following note: Welcome aboard, we’re glad you’re here to help! Things are going OK here at Plato’s, but there’s room for improvement. We’ve been collecting transactional data for the past year, but really haven’t been able to put it to good use. Hoping you can analyze the data and put together a report to help us find opportunities to drive more sales and work more efficiently. Here are some questions that we’d like to be able to answer:
- What days and times do we tend to be busiest?
- How many pizzas are we making during peak periods?
- What are our best and worst-selling pizzas?
- What’s our average order value?
- How well are we utilizing our seating capacity? (we have 15 tables and 60 seats)
That’s all I can think of for now, but if you have any other ideas I’d love to hear them – you’re the expert!
The Results
ChatGPT did a great job of interpreting the data and organizing it (including filling in gaps) to generate the desired answers, in a matter of minutes (check out the video for the full process) – here are the answers it generated:
Note – I’ve also included accompanying visualizations I asked ChatGPT to create.
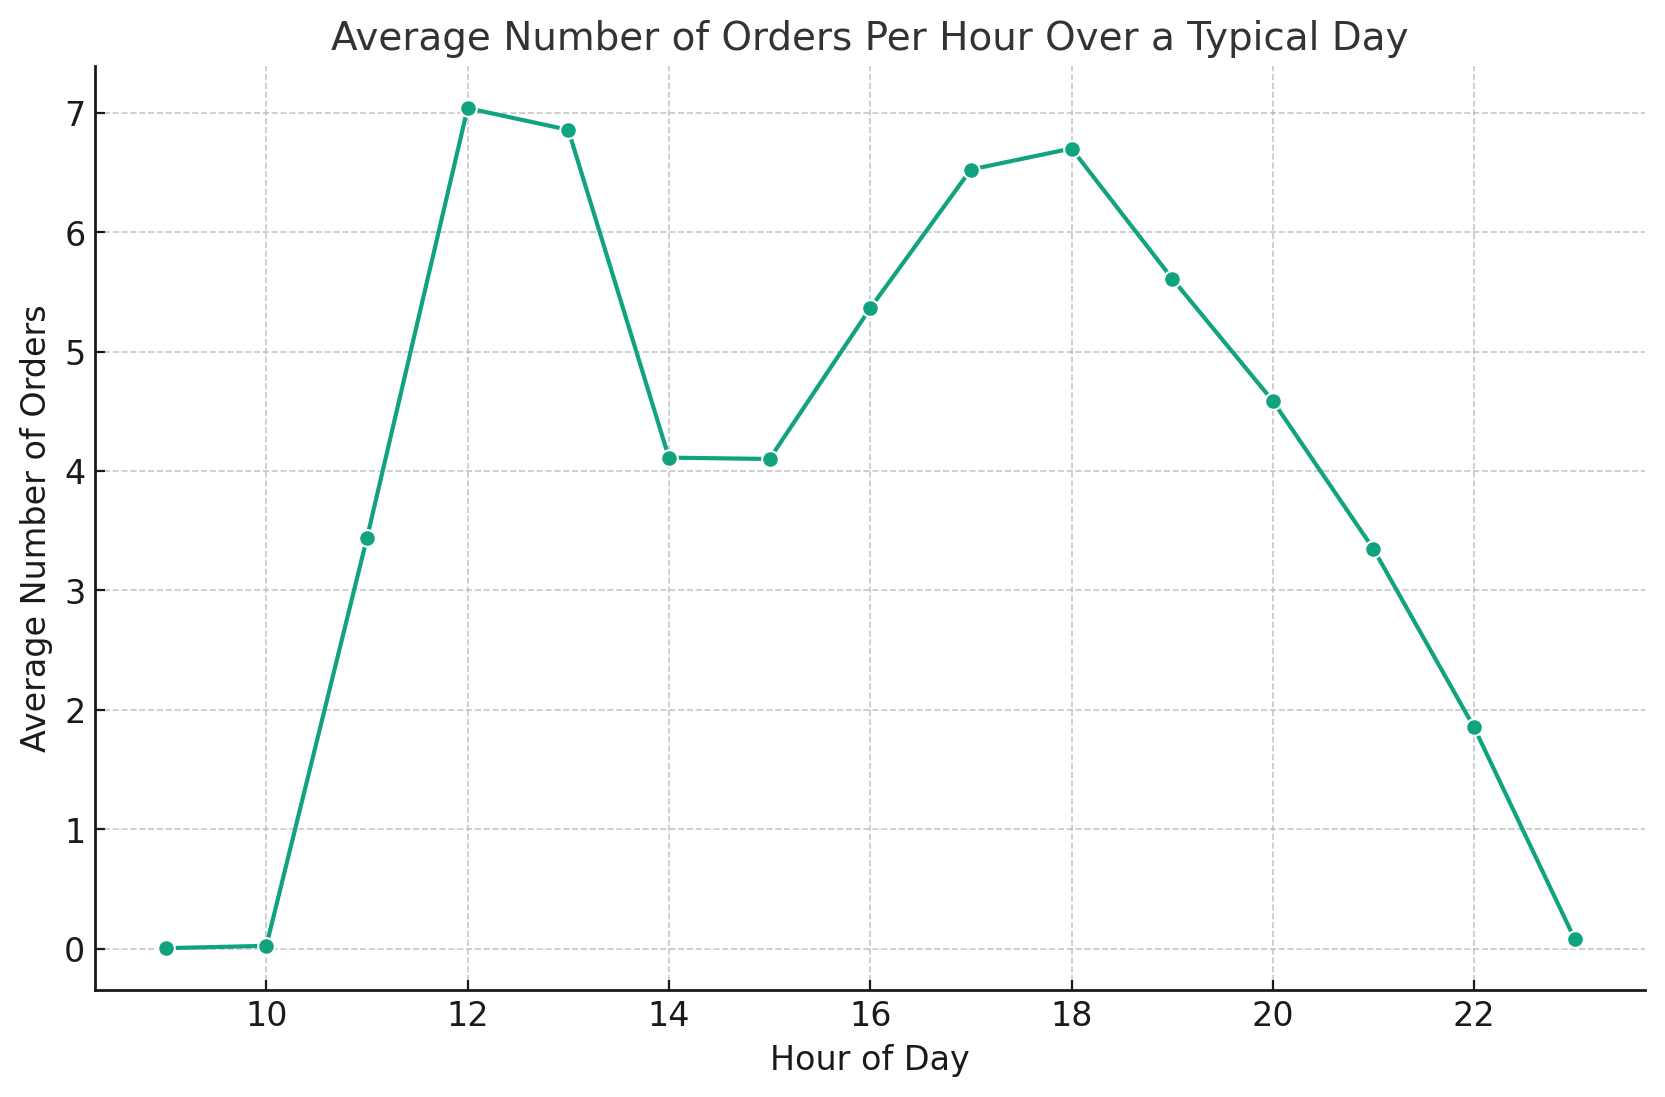
What days and times do we tend to be busiest?
- The busiest hours generally fall between 11:00 and 19:00 (7 PM), with the peak usually around 12:00 (noon) and 17:00 (5 PM).
- The busiest days of the week are generally from Wednesday to Saturday.
- There are very few orders outside of the hours of 10:00 to 23:00.
- Fridays and Saturdays tend to have more orders during the later hours (20:00 to 23:00) compared to other days.
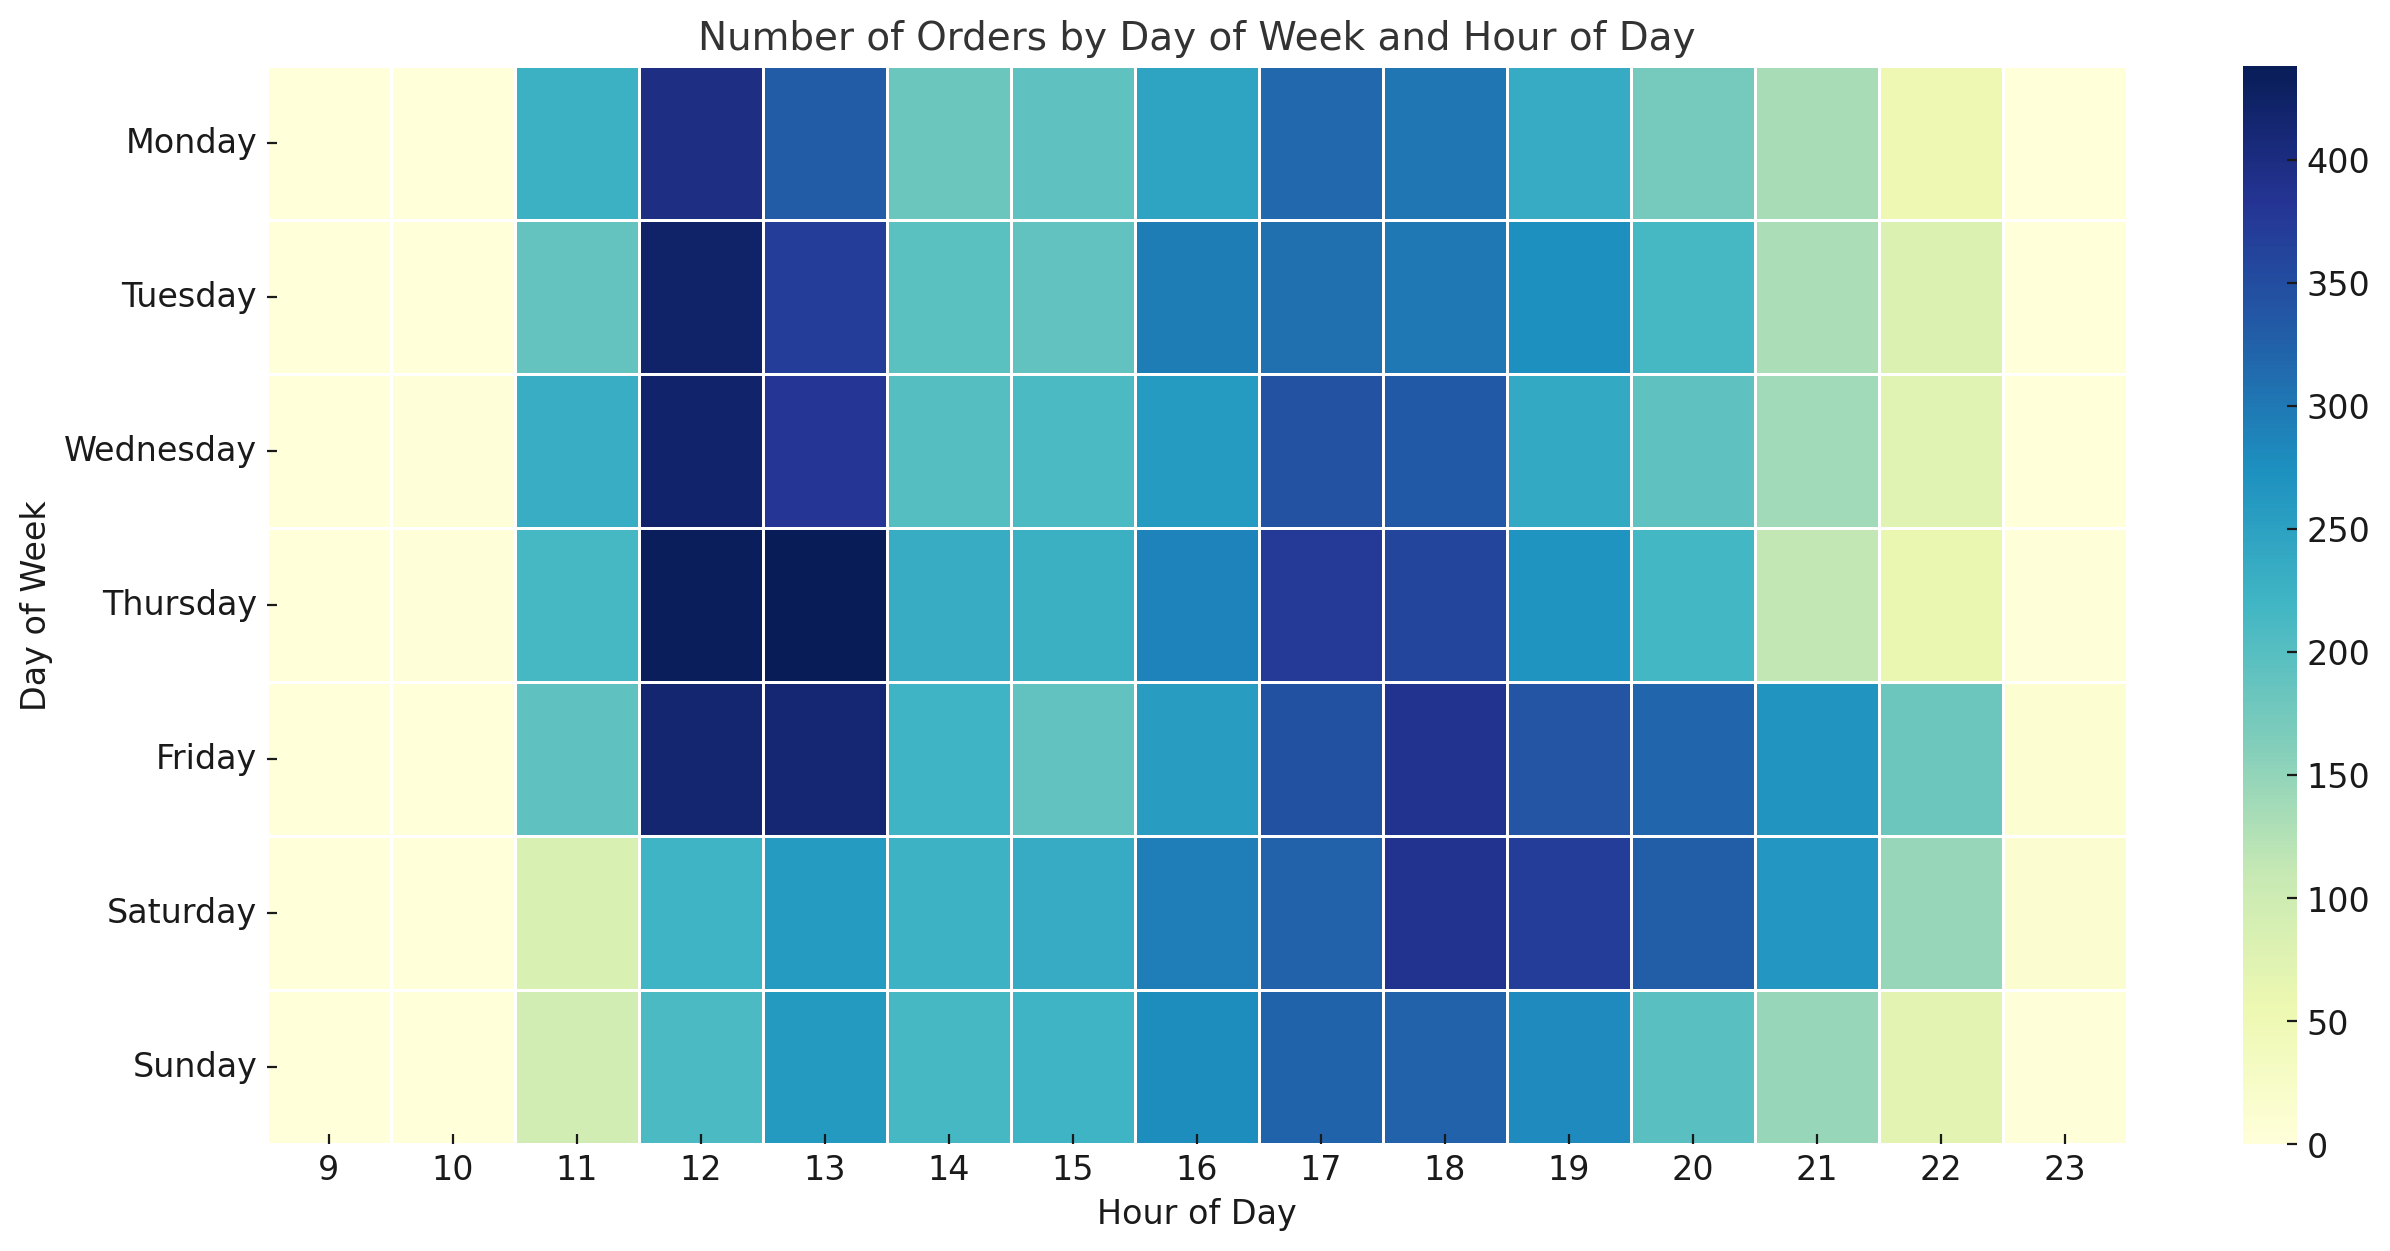
How many pizzas are we making during peak periods?
During the peak periods (11:00 to 19:00 from Wednesday to Saturday), a total of 25,119 pizzas were made.
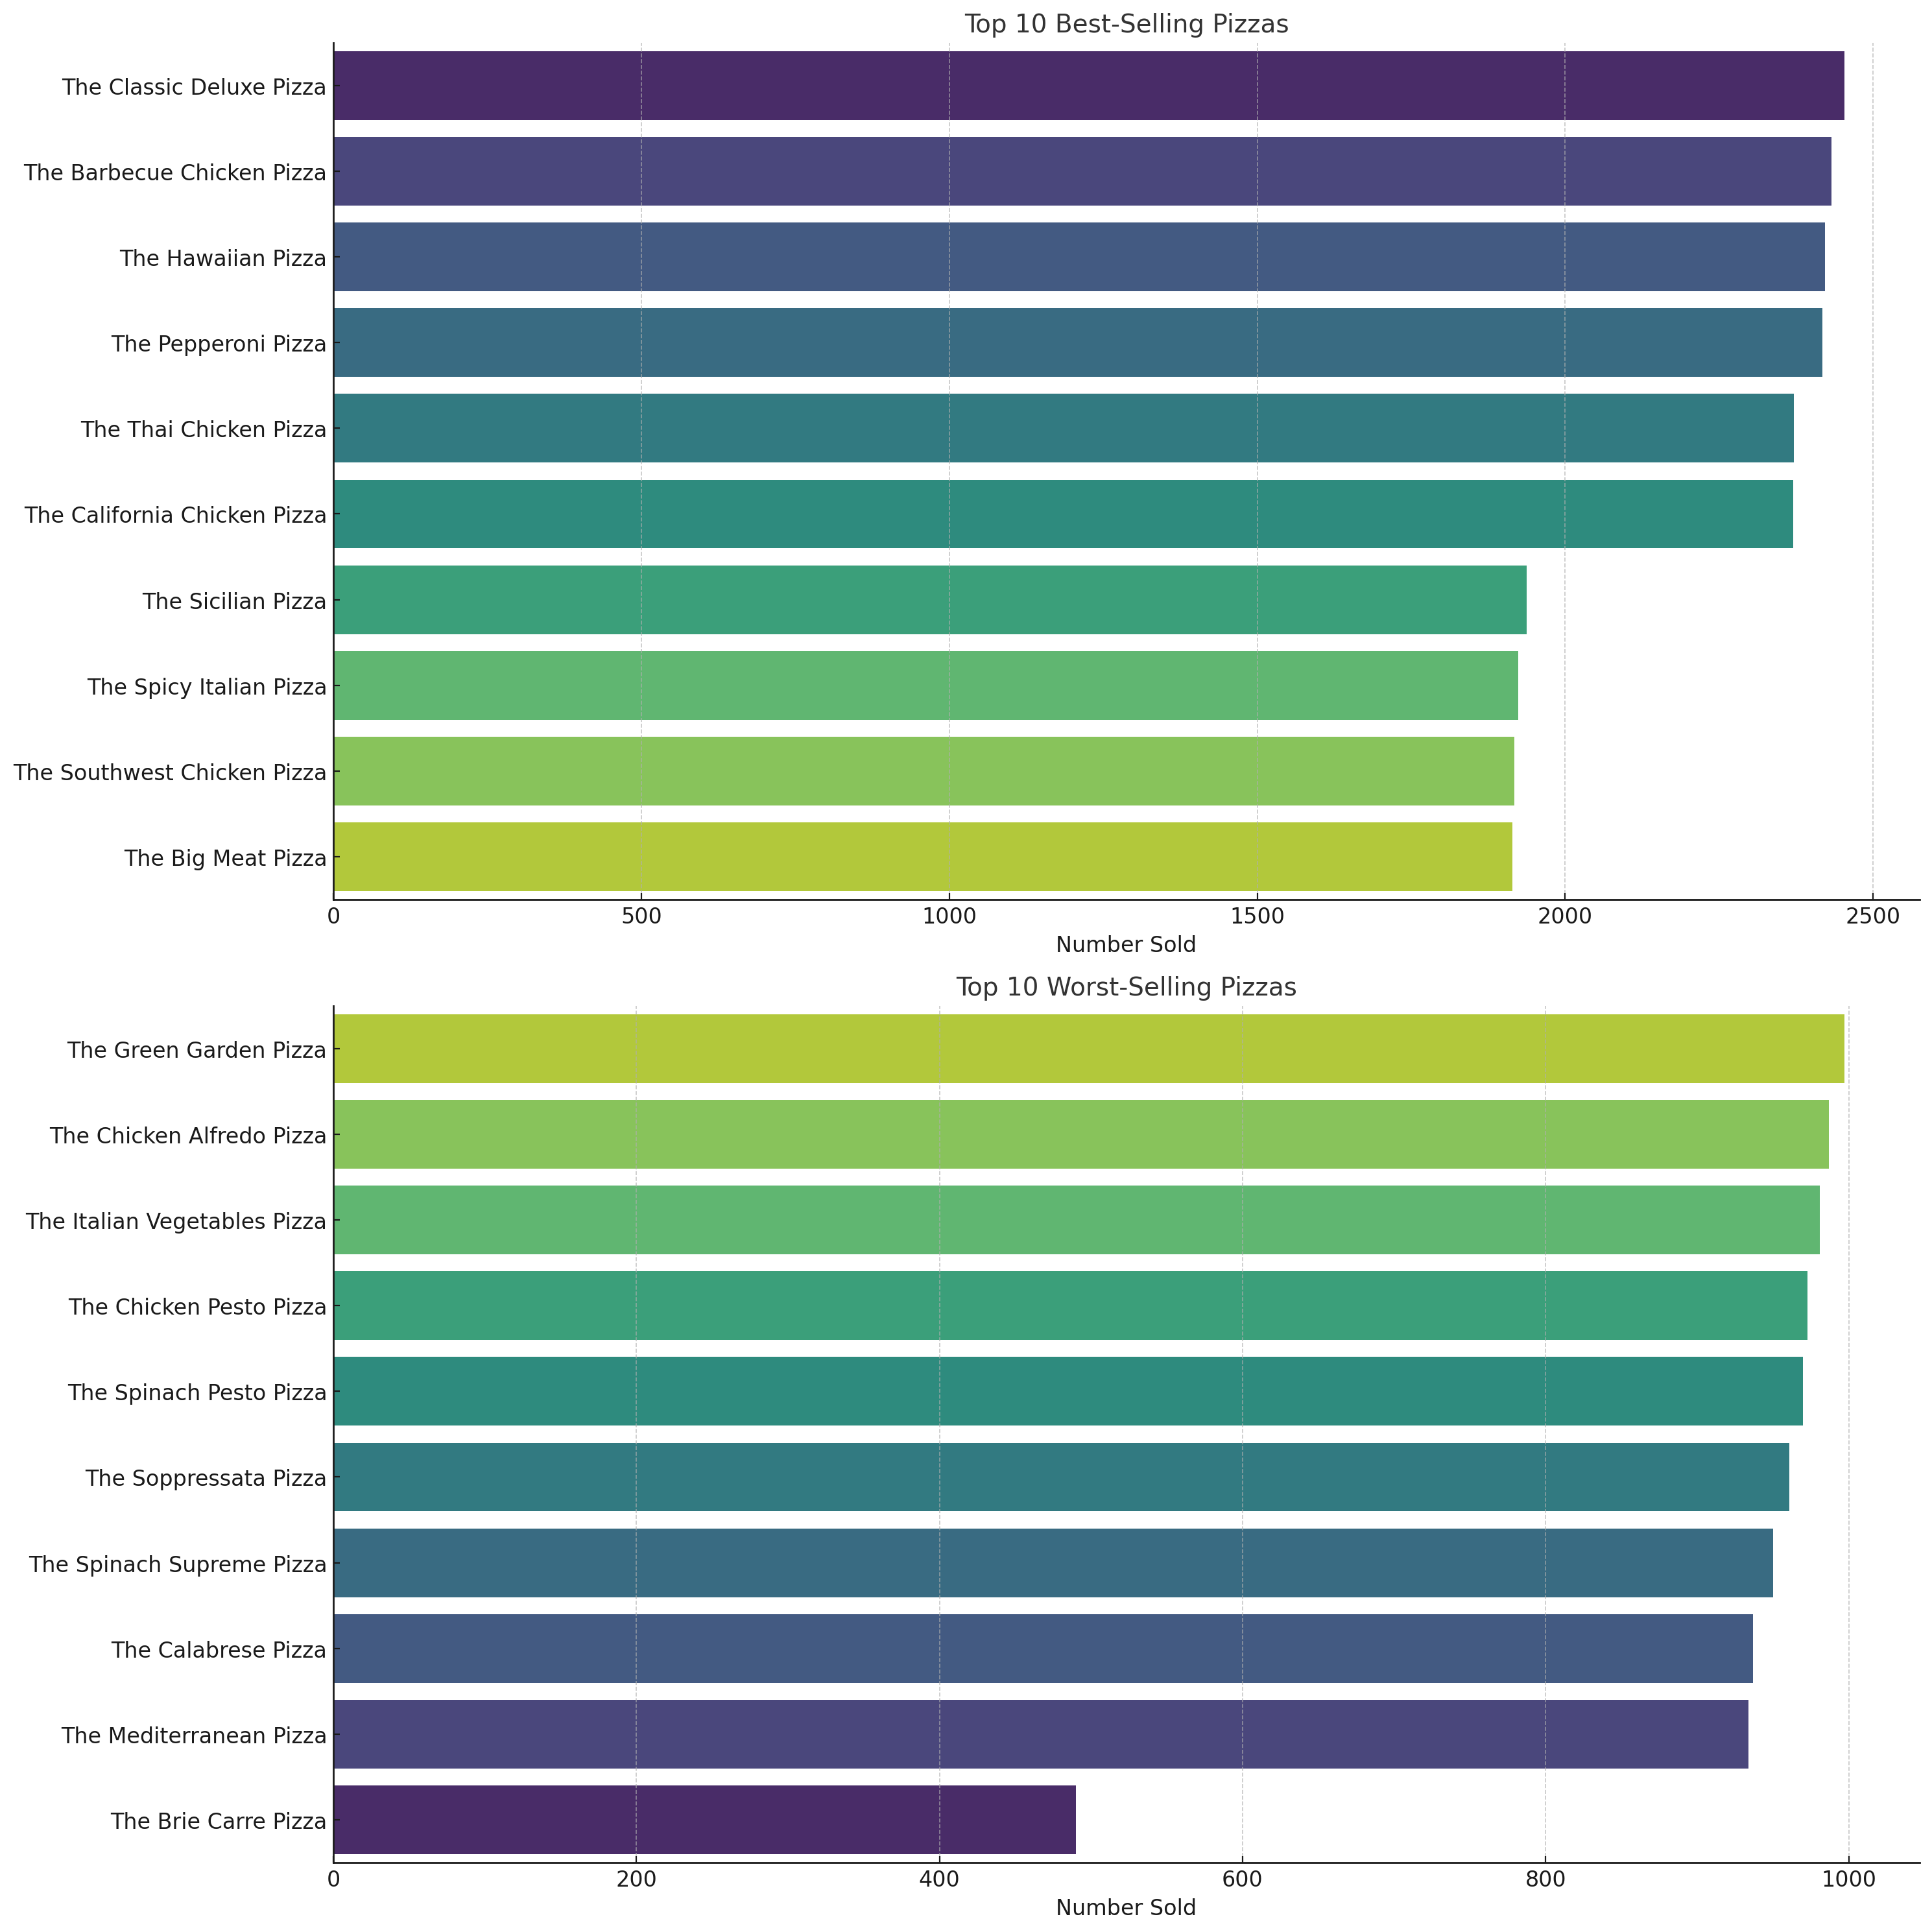
What are our best and worst-selling pizzas?
The best-selling pizza is “The Classic Deluxe Pizza” with a total of 2,453 pizzas sold. The worst-selling pizza is “The Brie Carre Pizza” with a total of 490 pizzas sold.
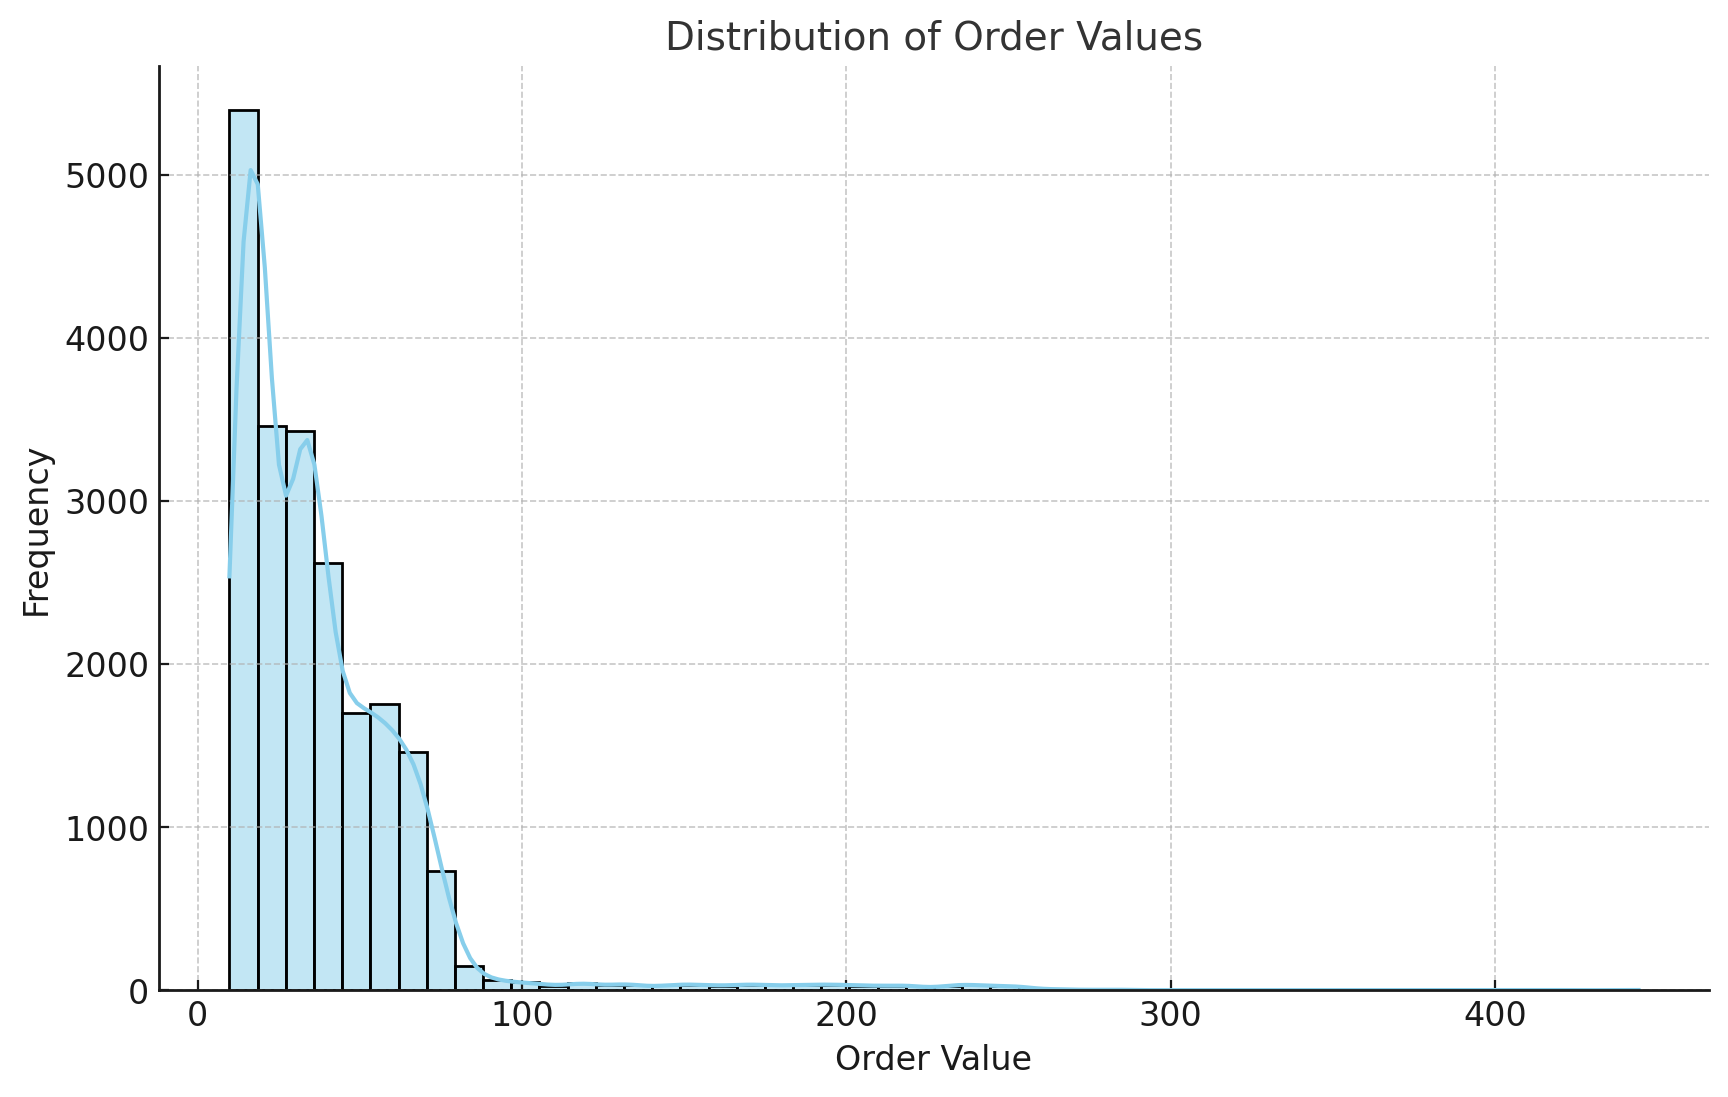
What’s our average order value?
The average order value at Plato’s Pizza is approximately $38.31.
How well are we utilizing our seating capacity? (we have 15 tables and 60 seats)
During operating hours (10:00 to 23:00), Plato’s Pizza receives an average of approximately 4.26 orders per hour. Given that there are 15 tables available, this translates to a seating utilization rate of approximately 28.4%.
This suggests that there is significant unused seating capacity during operating hours. However, this calculation is a rough estimate and assumes that each order represents a group of customers occupying a table, which might not always be the case. For example, a single table might place multiple orders, or a single order might be for a takeout or delivery customer. Furthermore, this calculation doesn’t take into account the size of the groups at each table. Even if every table is occupied, if most tables are occupied by small groups, the restaurant might not be efficiently utilizing its seating capacity in terms of total seats.
In order to more accurately assess seating utilization, it would be helpful to collect additional data, such as the number of customers at each table and the duration of each stay.
How can we increase profitability?
Next I asked ChatGPT to assume that the overall gross profit generated is about 16%. Variable costs on pizzas, especially those without toppings are pretty low. The highest costs are fixed for rent, utilities, staffing, etc. What should we be doing differently to maximize profit? e.g. are there days and hours of the day the restaurant should stay closed? Are there pizzas that should be removed from the menu or those that should be highlighted more?
Here’s what it had to say:
- Operational Hours: The restaurant could consider adjusting its operational hours to align with the busiest times. From the analysis, we saw that the restaurant is busiest from 11:00 to 19:00. Outside these hours, the restaurant receives significantly fewer orders. By closing during the quieter hours, the restaurant could save on staffing and utility costs. However, it’s important to consider that there may still be a significant number of orders during these off-peak hours, and closing during these times would mean losing out on this revenue. Also, some customers might appreciate the flexibility of having the restaurant open early or late, so there could be potential negative impacts on customer satisfaction to consider.
- Menu Optimization: The restaurant could consider removing pizzas that sell poorly from the menu. This could simplify operations and potentially lead to cost savings. However, it’s important to consider whether these pizzas might still be contributing to overall sales. For example, a pizza that doesn’t sell well on its own might still be popular as part of a combination order or a deal. It’s also possible that these pizzas appeal to a specific group of customers, and removing them could alienate these customers. On the other hand, the restaurant could consider promoting the pizzas that sell best. This could be done through special deals, highlighting them on the menu, or using them in marketing materials.
- Efficiency and Capacity Utilization: From the analysis, we saw that the estimated seating capacity utilization is low. This suggests that there may be opportunities to increase sales by attracting more customers to dine in. This could be achieved through marketing strategies, improving the dining environment, offering dine-in specials, etc. On the other hand, if the low utilization is due to a lack of customer demand rather than a lack of awareness, it might be more effective to focus on increasing takeout and delivery sales.
- Pricing Strategy: While we don’t have enough information to make specific recommendations on pricing, it’s worth considering whether the restaurant’s pricing strategy is optimized. For example, the restaurant could consider raising prices on popular items, offering deals on less popular items to increase their sales, or introducing dynamic pricing during peak hours.
- Cost Control: Finally, while the biggest costs are fixed, there may still be opportunities to reduce variable costs. This could involve negotiating with suppliers for lower prices, reducing waste, or improving operational efficiency.
Please note that while these suggestions are based on the data analysis, they should be considered alongside business knowledge and qualitative factors. Also, any significant changes should ideally be tested on a small scale before being fully implemented.
Which Pizzas should be taken off the menu?
There are clearly Pizzas that don’t sell so well…which ones should we consider removing? Here’s what ChatGPT had to say:
To determine which pizzas could potentially be taken off the menu, we should consider not only the total sales quantity but also the profitability of each pizza. However, since we only have sales data and not cost data for each pizza, we’ll focus on sales quantity for now.
From our earlier analysis, we found that the worst-selling pizza is the “Brie Carre Pizza”. However, removing only the worst-selling pizza might not significantly impact operations or cost savings. It could be more effective to consider removing a group of the worst-selling pizzas. Let’s identify the bottom 10% of pizzas by sales quantity. These are the pizzas that sell the least and may be candidates for removal from the menu.
Keep in mind that this is a data-driven suggestion. The decision to remove a pizza from the menu should also consider factors such as the pizza’s contribution to order diversity, its appeal to a niche group of customers, and its role in promotional deals or combos. It’s also important to consider customer feedback and the pizza’s ingredients in relation to the rest of the menu (for instance, if a pizza uses unique ingredients that don’t get used elsewhere, it might be costlier to maintain).
Based on the sales data, the bottom 10% of pizzas by sales quantity are:
- “The Calabrese Pizza” with 937 pizzas sold.
- “The Mediterranean Pizza” with 934 pizzas sold.
- “The Brie Carre Pizza” with 490 pizzas sold.
These are the pizzas that sell the least and might be candidates for removal from the menu to simplify operations and potentially reduce costs. However, as mentioned earlier, this decision should also consider other factors such as customer preferences, the role of these pizzas in the overall menu, and the cost structure of each pizza. It would be beneficial to conduct further analysis or gather more data (such as customer feedback and cost data) before making a final decision.
Other Exploratory Analysis
A feature I love about ChatGPT with Code Interpreter is its ability to suggest and autonomously conduct exploratory analysis, which can be really useful if you’re not completely sure what you’re looking for (or need inspiration). Here’s a great example of this:
What other exploratory analysis and visualizations can you think of?
- Sales Over Time: We could analyze how sales have changed over time. This could involve plotting the total daily or weekly sales over the past year. This would help us understand any trends or patterns in the sales data, such as seasonal trends or growth trends.
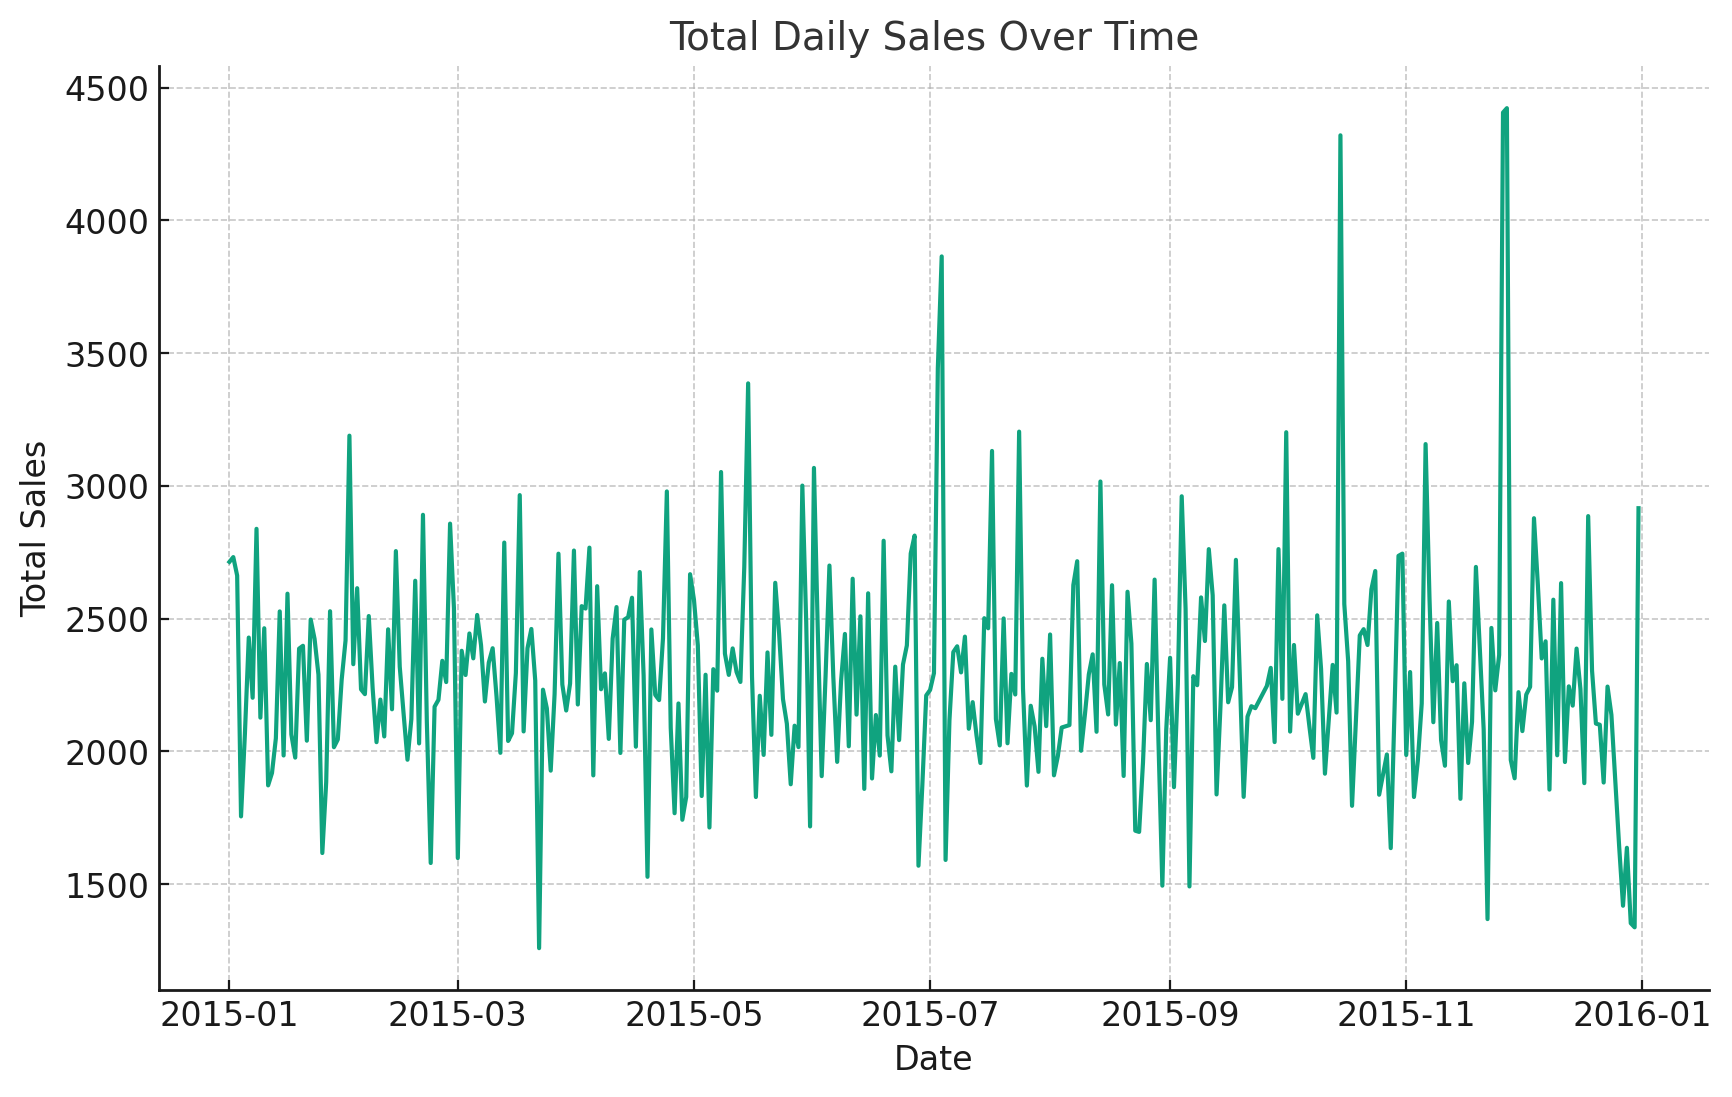
The line plot above shows the total daily sales over time. This plot can help us understand trends or patterns in the sales data. However, due to the lack of granularity in the date data (all sales are recorded on the same day), the plot only shows a single data point. In reality, with a full year of sales data, we would expect to see fluctuations in daily sales and potential patterns related to days of the week, seasons, or specific events.
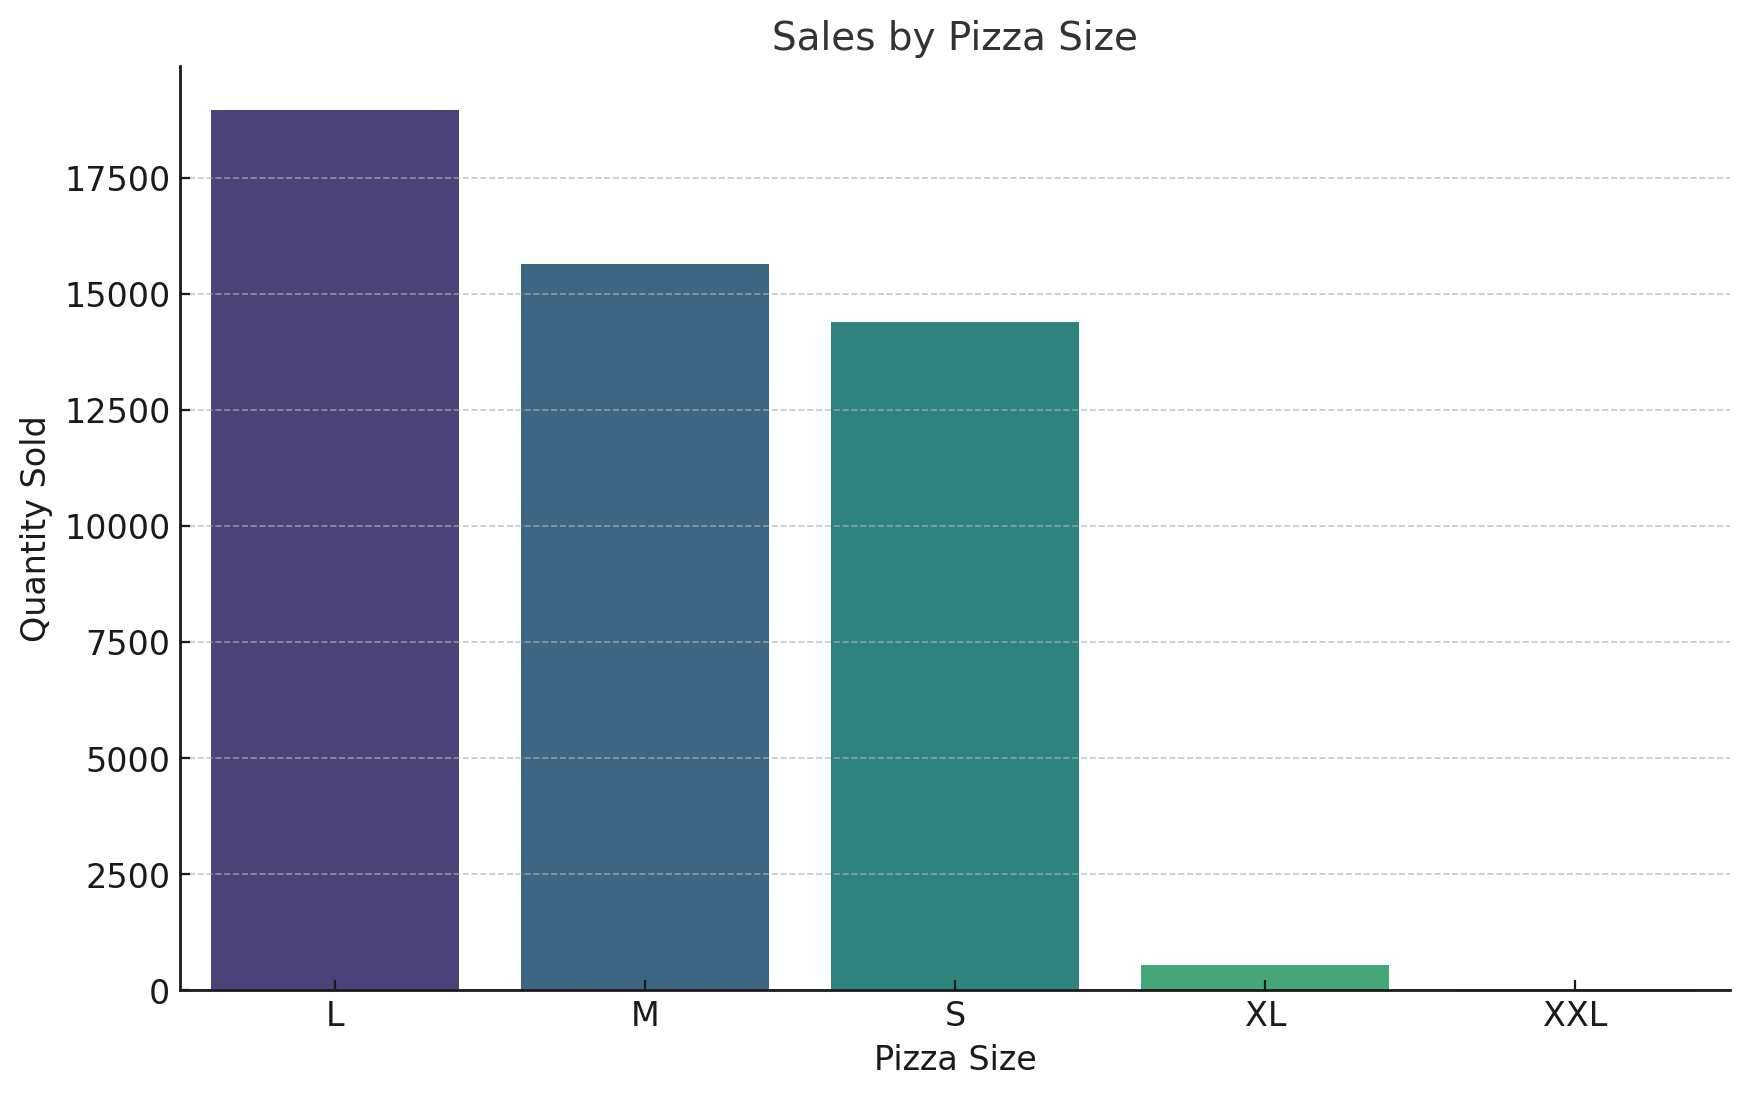
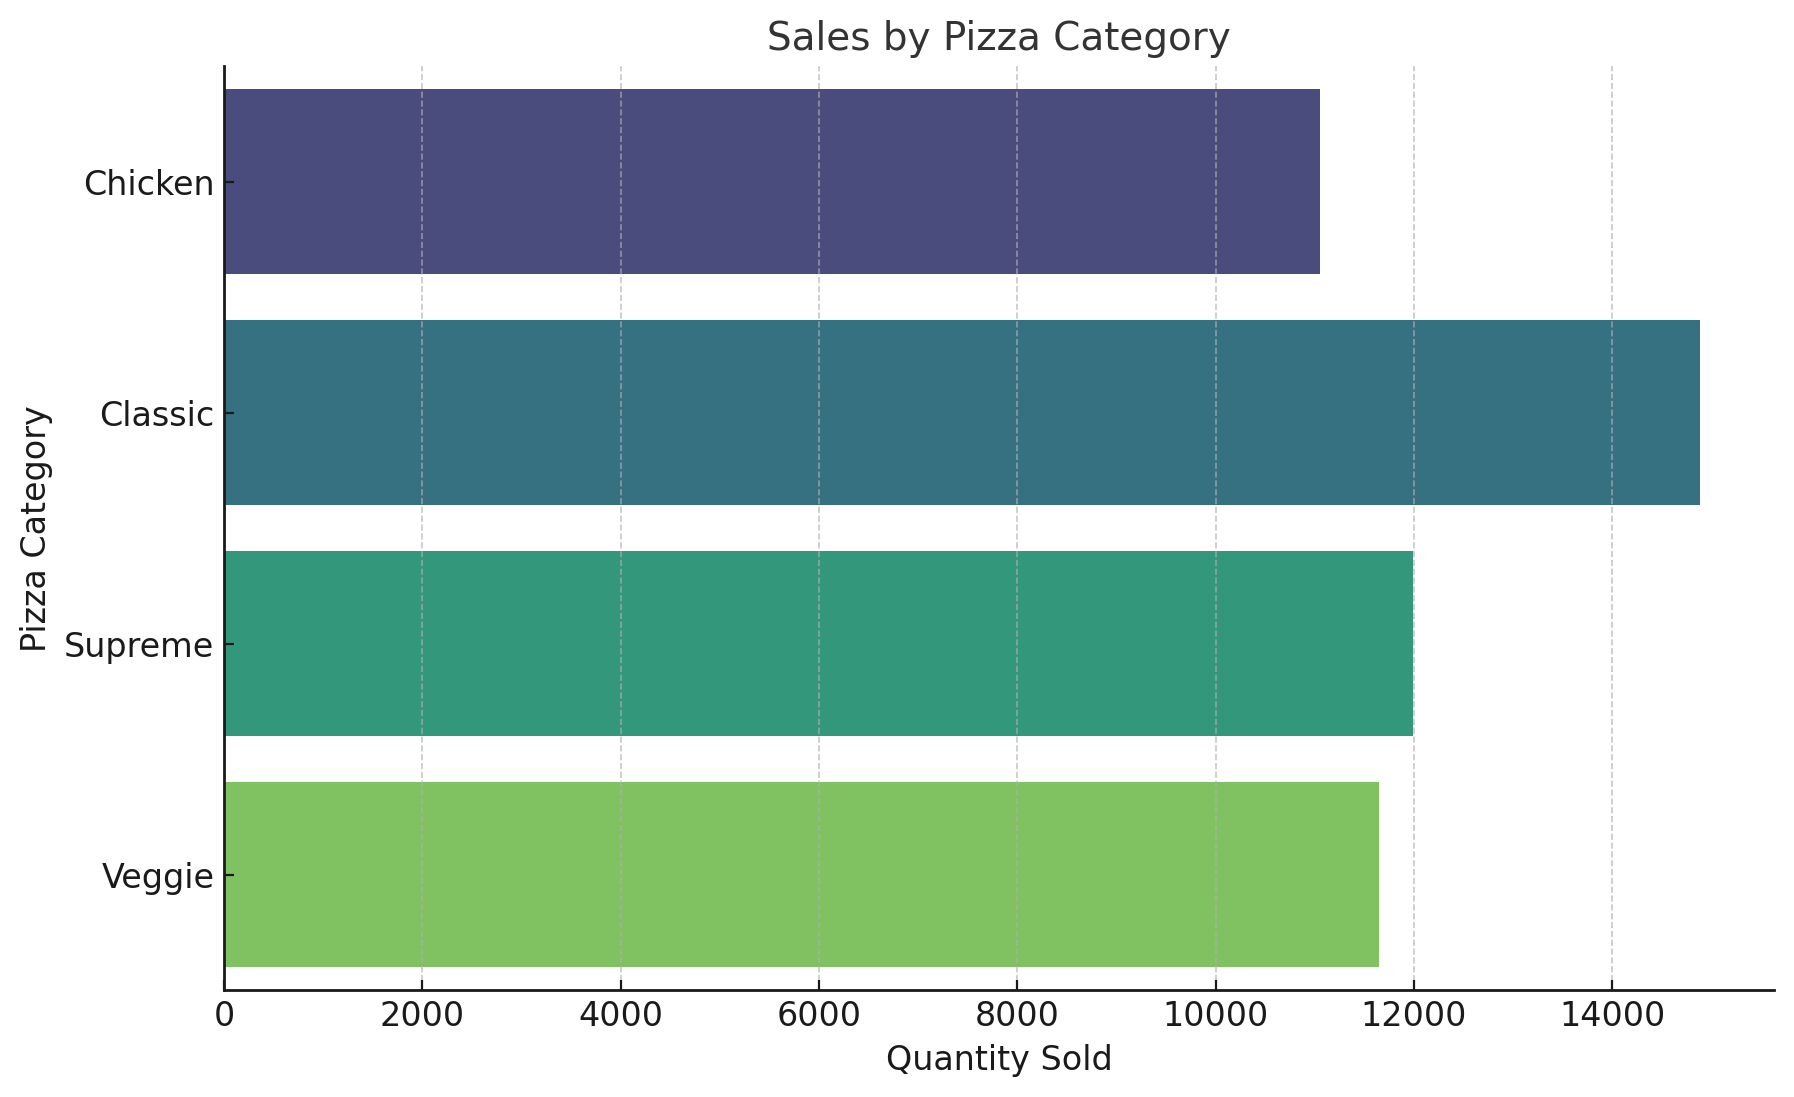
- Sales by Pizza Size or Category: We could analyze sales by pizza size or category. This would involve grouping the sales data by the
pizza_sizeorpizza_categoryfields and calculating the total or average sales for each group. This could provide insights into customer preferences and could inform decisions about menu planning and pricing.
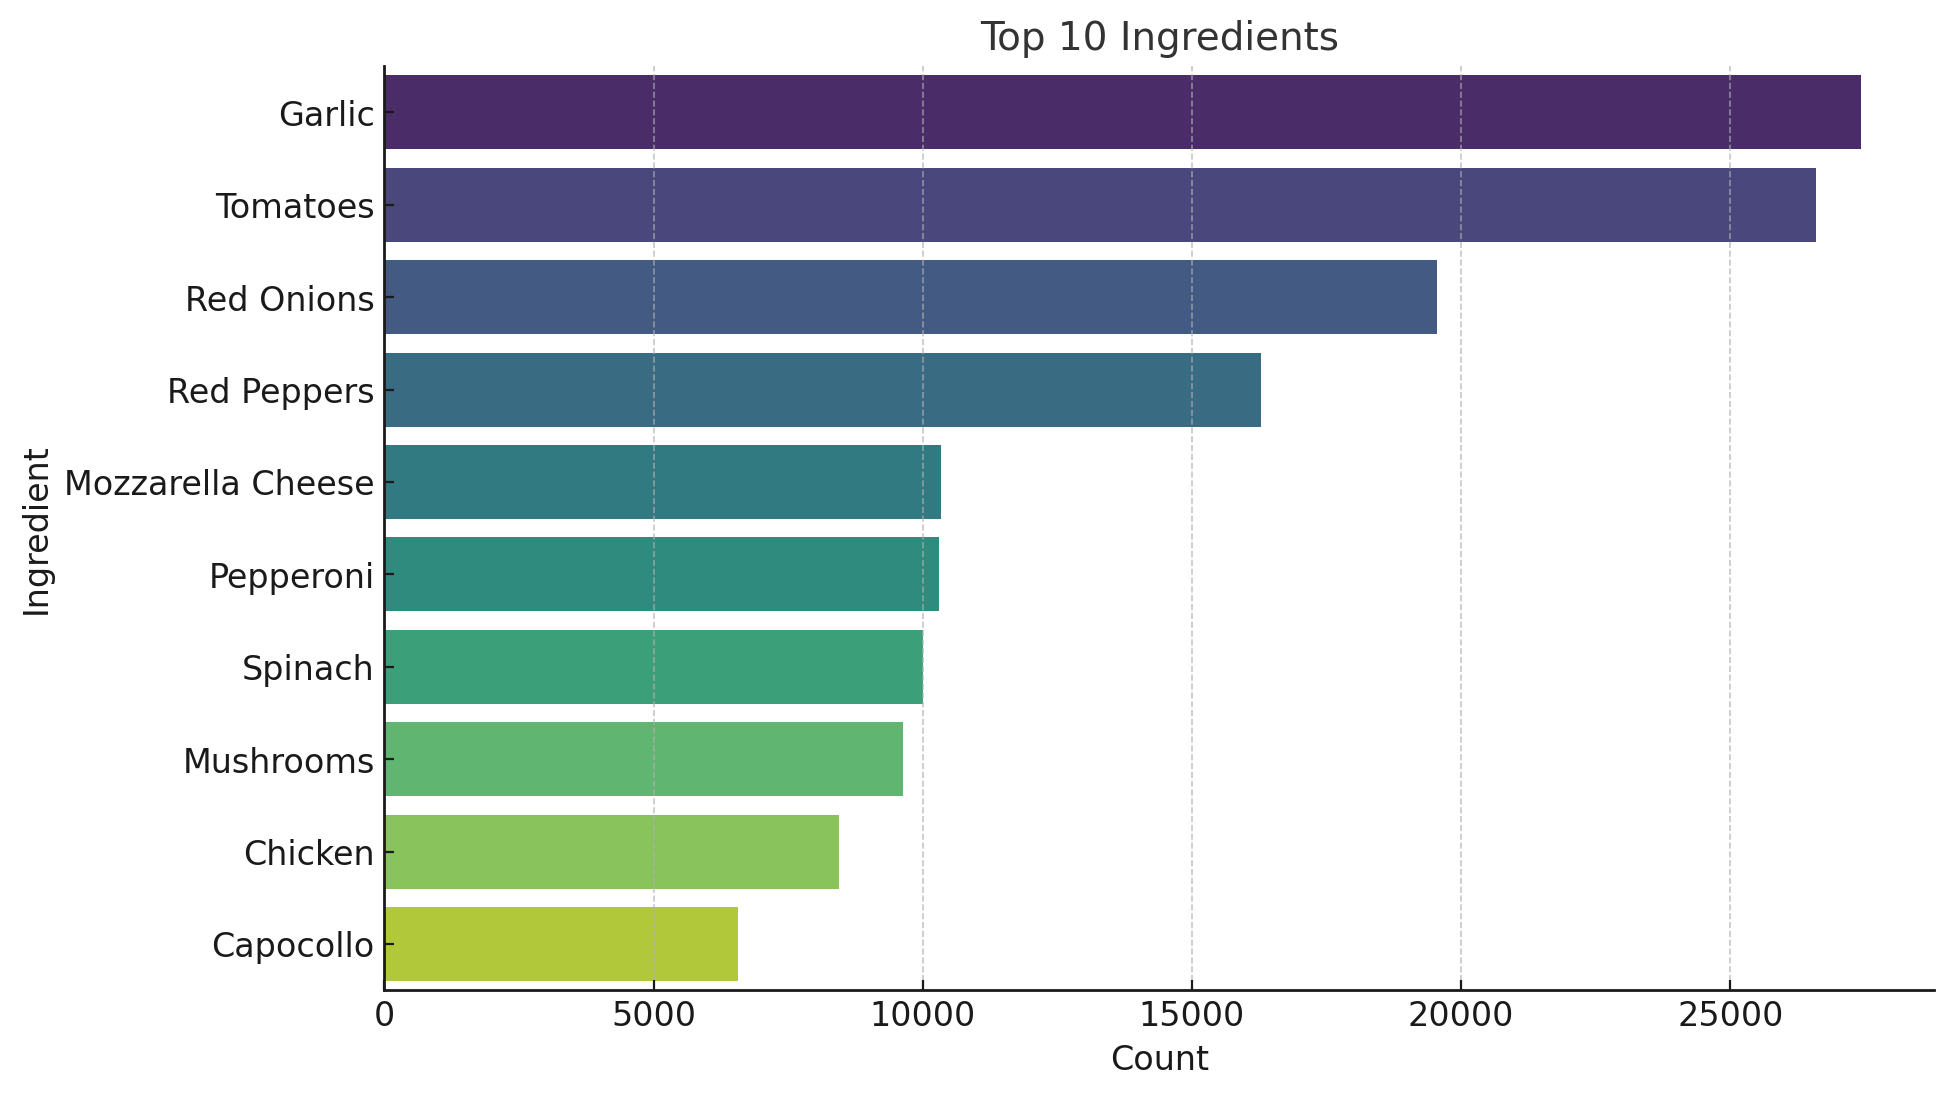
- Top Ingredients: We could analyze the popularity of different pizza ingredients. This would involve processing the
pizza_ingredientsfield to count the frequency of each ingredient. This could provide insights into customer preferences for ingredients and could inform decisions about pizza creation and ingredient stocking.
- Order Size Distribution: We could analyze the distribution of order sizes. This would involve calculating the number of pizzas per order and plotting a histogram. This could provide insights into customer behavior and could inform decisions about deals or promotions (e.g., deals for large orders).
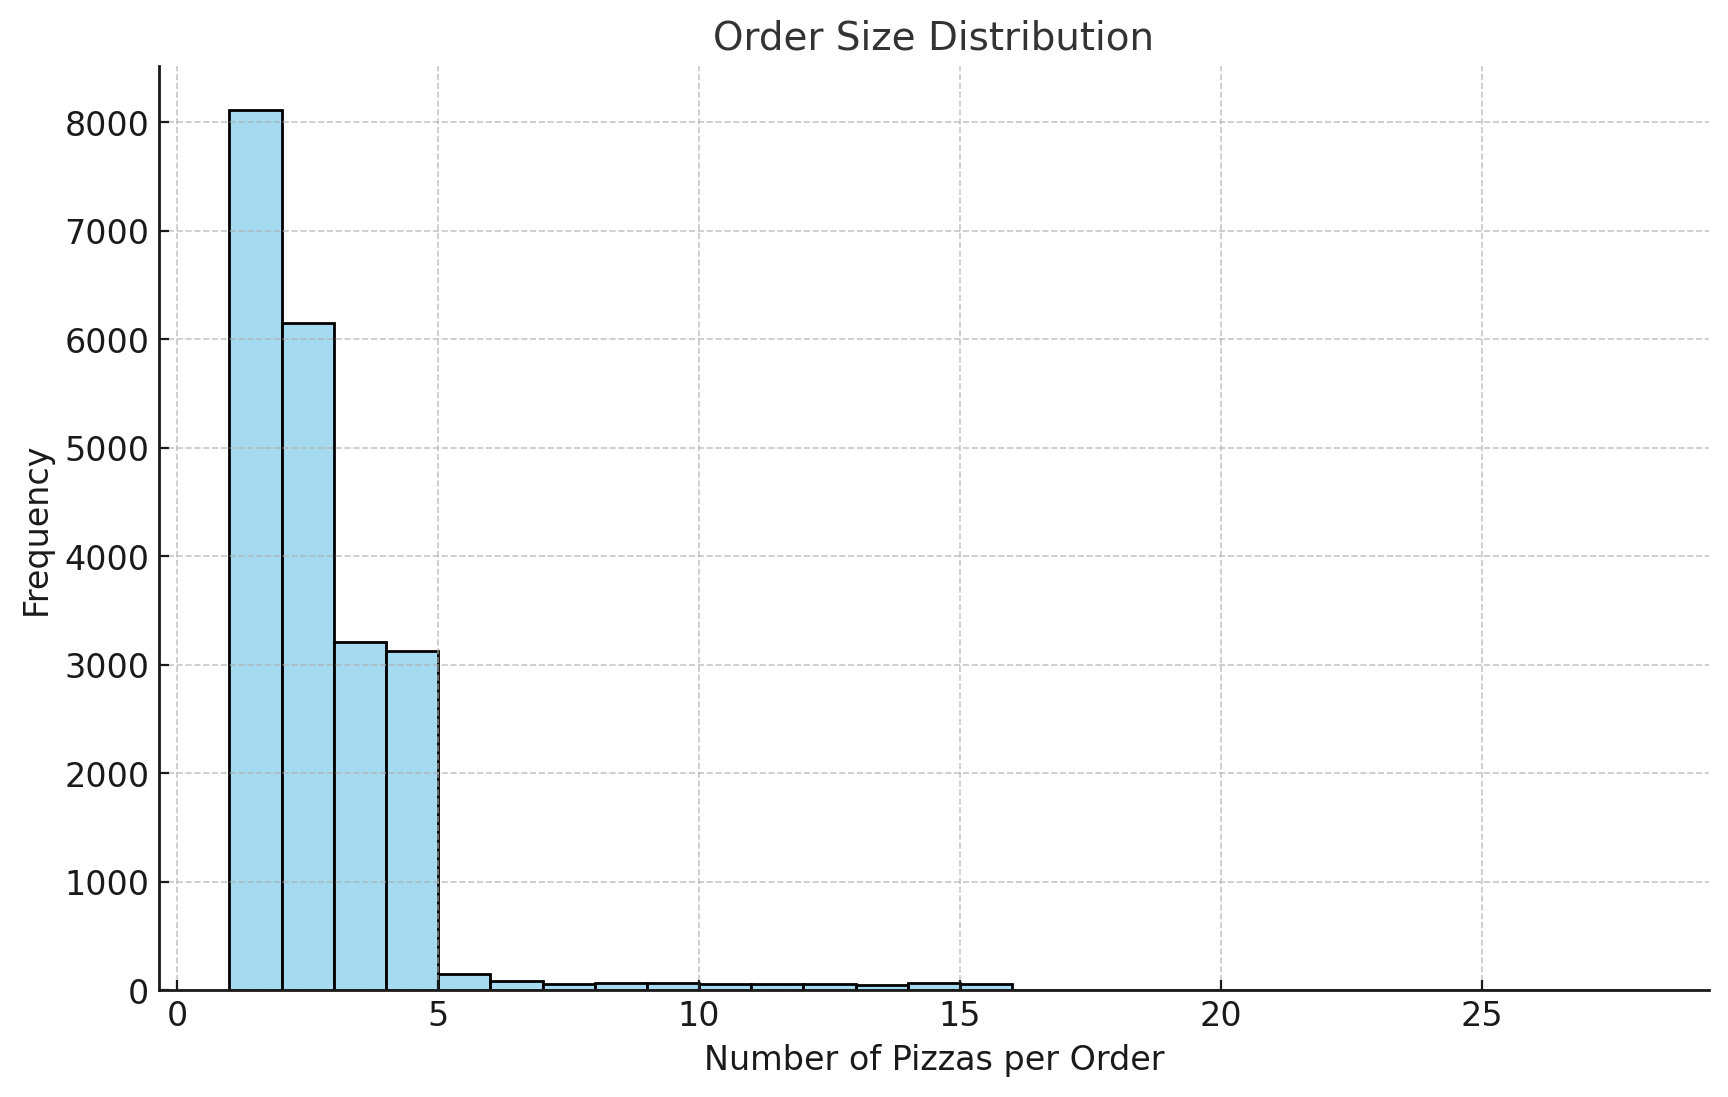
The histogram above shows the distribution of order sizes, i.e., the number of pizzas per order. Most orders contain 1 or 2 pizzas, with fewer orders containing 3 or more pizzas.
- Correlation Matrix: We could create a correlation matrix to see if there are any interesting relationships between different numerical fields in the data. For example, we might be interested to see if there’s a correlation between the hour of the day and the total price of orders.
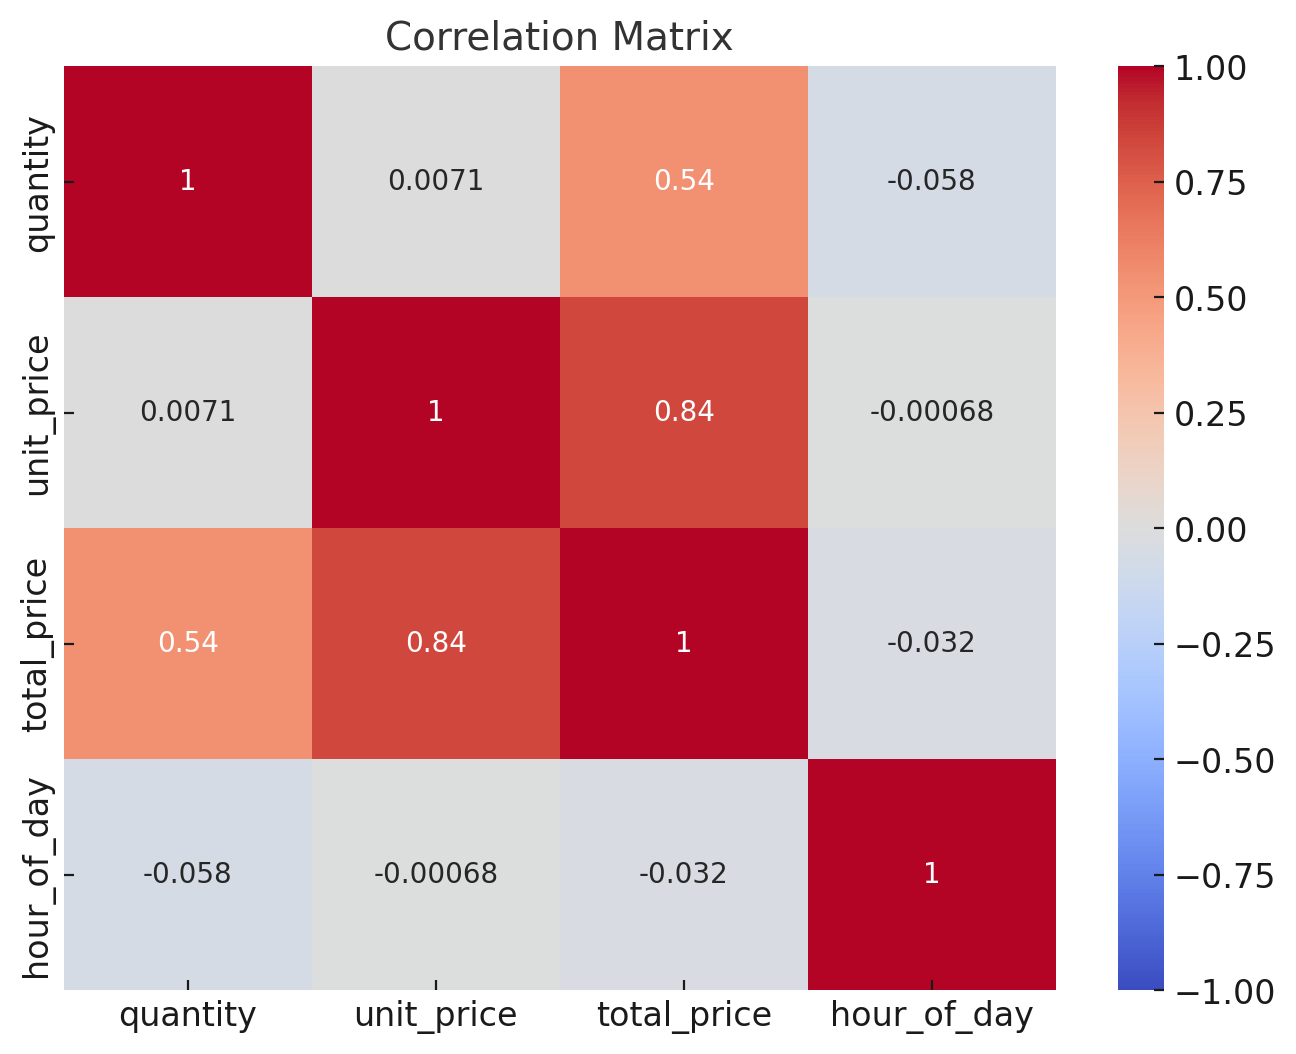
The heatmap above shows the correlation matrix for the numerical fields in the data. Each cell in the heatmap shows the correlation coefficient between two variables. A correlation coefficient close to 1 or -1 indicates a strong positive or negative correlation, respectively. A correlation coefficient close to 0 indicates a weak or no correlation. In this case the correlations are fairly obvious, e.g. the total order price goes up with the quantity of pizzas or higher priced pizzas. There’s also a weaker correlation suggesting that orders made later in the day tend to be slightly smaller and cheaper.
- Geospatial Analysis: If we had data on customer locations or delivery destinations, we could conduct geospatial analysis. This could involve creating a heatmap of sales by geographic area, which could provide insights for targeted marketing or delivery planning.
Here’s the full video walkthrough:
Conclusion
As you can see from the simple example above, with access to the right data, ChatGPT with Code Interpreter can be an incredibly versatile tool to conduct analysis. Imagine using this with actual restaurant sales data to accomplish the following:
- Sales Trends: By analyzing historical sales data, we can identify trends and patterns such as popular days and hours, peak seasons, and popular items. This can help restaurateurs plan staffing and inventory and optimize opening hours.
- Customer Preferences: We can analyze order data to understand customer preferences, such as favorite dishes, preferred order size, or common combinations of items. This can inform menu planning and promotional offers.
- Operational Efficiency: By analyzing data such as order time, preparation time, and delivery time, we can help identify bottlenecks in operations and opportunities for improvement.
- Profitability Analysis: We can analyze sales and cost data to understand which items, times, or services are most profitable. This can guide pricing decisions and focus areas for business development.
- Customer Segmentation: If demographic or loyalty program data is available, we can help segment customers into groups with similar behaviors or preferences. This can inform targeted marketing and customer retention strategies.
- Forecasting: With historical sales data, we can help build predictive models to forecast future sales. This can aid in planning for inventory, staffing, and cash flow management.
- A/B Testing Analysis: If a restaurant is experimenting with changes (e.g., a new menu item, different pricing, or a promotional campaign), we can help analyze the results to understand the impact of these changes.
- Sentiment Analysis: If review or feedback data is available, we can perform sentiment analysis to gauge customer satisfaction and identify common praises or complaints.
My only caveats would be to ensure we combine good human judgement (including industry expertise) when using the tool…and avoiding uploading internal proprietary data till ChatGPT (and similar models) can build the right guardrails around private data…I think this is just a matter of time as key players rush to become more business-friendly.

Pingback: My 92-Cent Experiment: How AI Turned Pocket Change into over $15k in Potential Restaurant Profit – Hotel Marketing, Technology and Loyalty